> ## Documentation Index
> Fetch the complete documentation index at: https://docs.codemod.com/llms.txt
> Use this file to discover all available pages before exploring further.
# Insights
In large, evolving codebases, migrations, API transitions, and security anti-patterns often go unnoticed.
Codemod Insights helps you turn repository data into dashboards that show migration progress, API adoption, dependency exposure, and other codebase signals over time.
## How insights work
When you run migrations across many repositories and teams, you need visibility into what changed, what is left, and who owns the remaining work. Insights gives you that visibility through a few reusable building blocks:
* **[Dashboards](#dashboards)** group related widgets around a migration, initiative, or team.
* **[Widgets](#widgets)** show query results as timeseries charts, single numbers, tables, or notes.
* **[Queries](#queries)** pull data from repositories using JSSG codemods, ast-grep YAML rules, Smart natural-language checks, or indexed dependency data.
* **[Template variables](#template-variables)** let you reuse the same dashboard with different repositories, rules, JSSG sources, Smart prompts, or string inputs.
## Dashboards
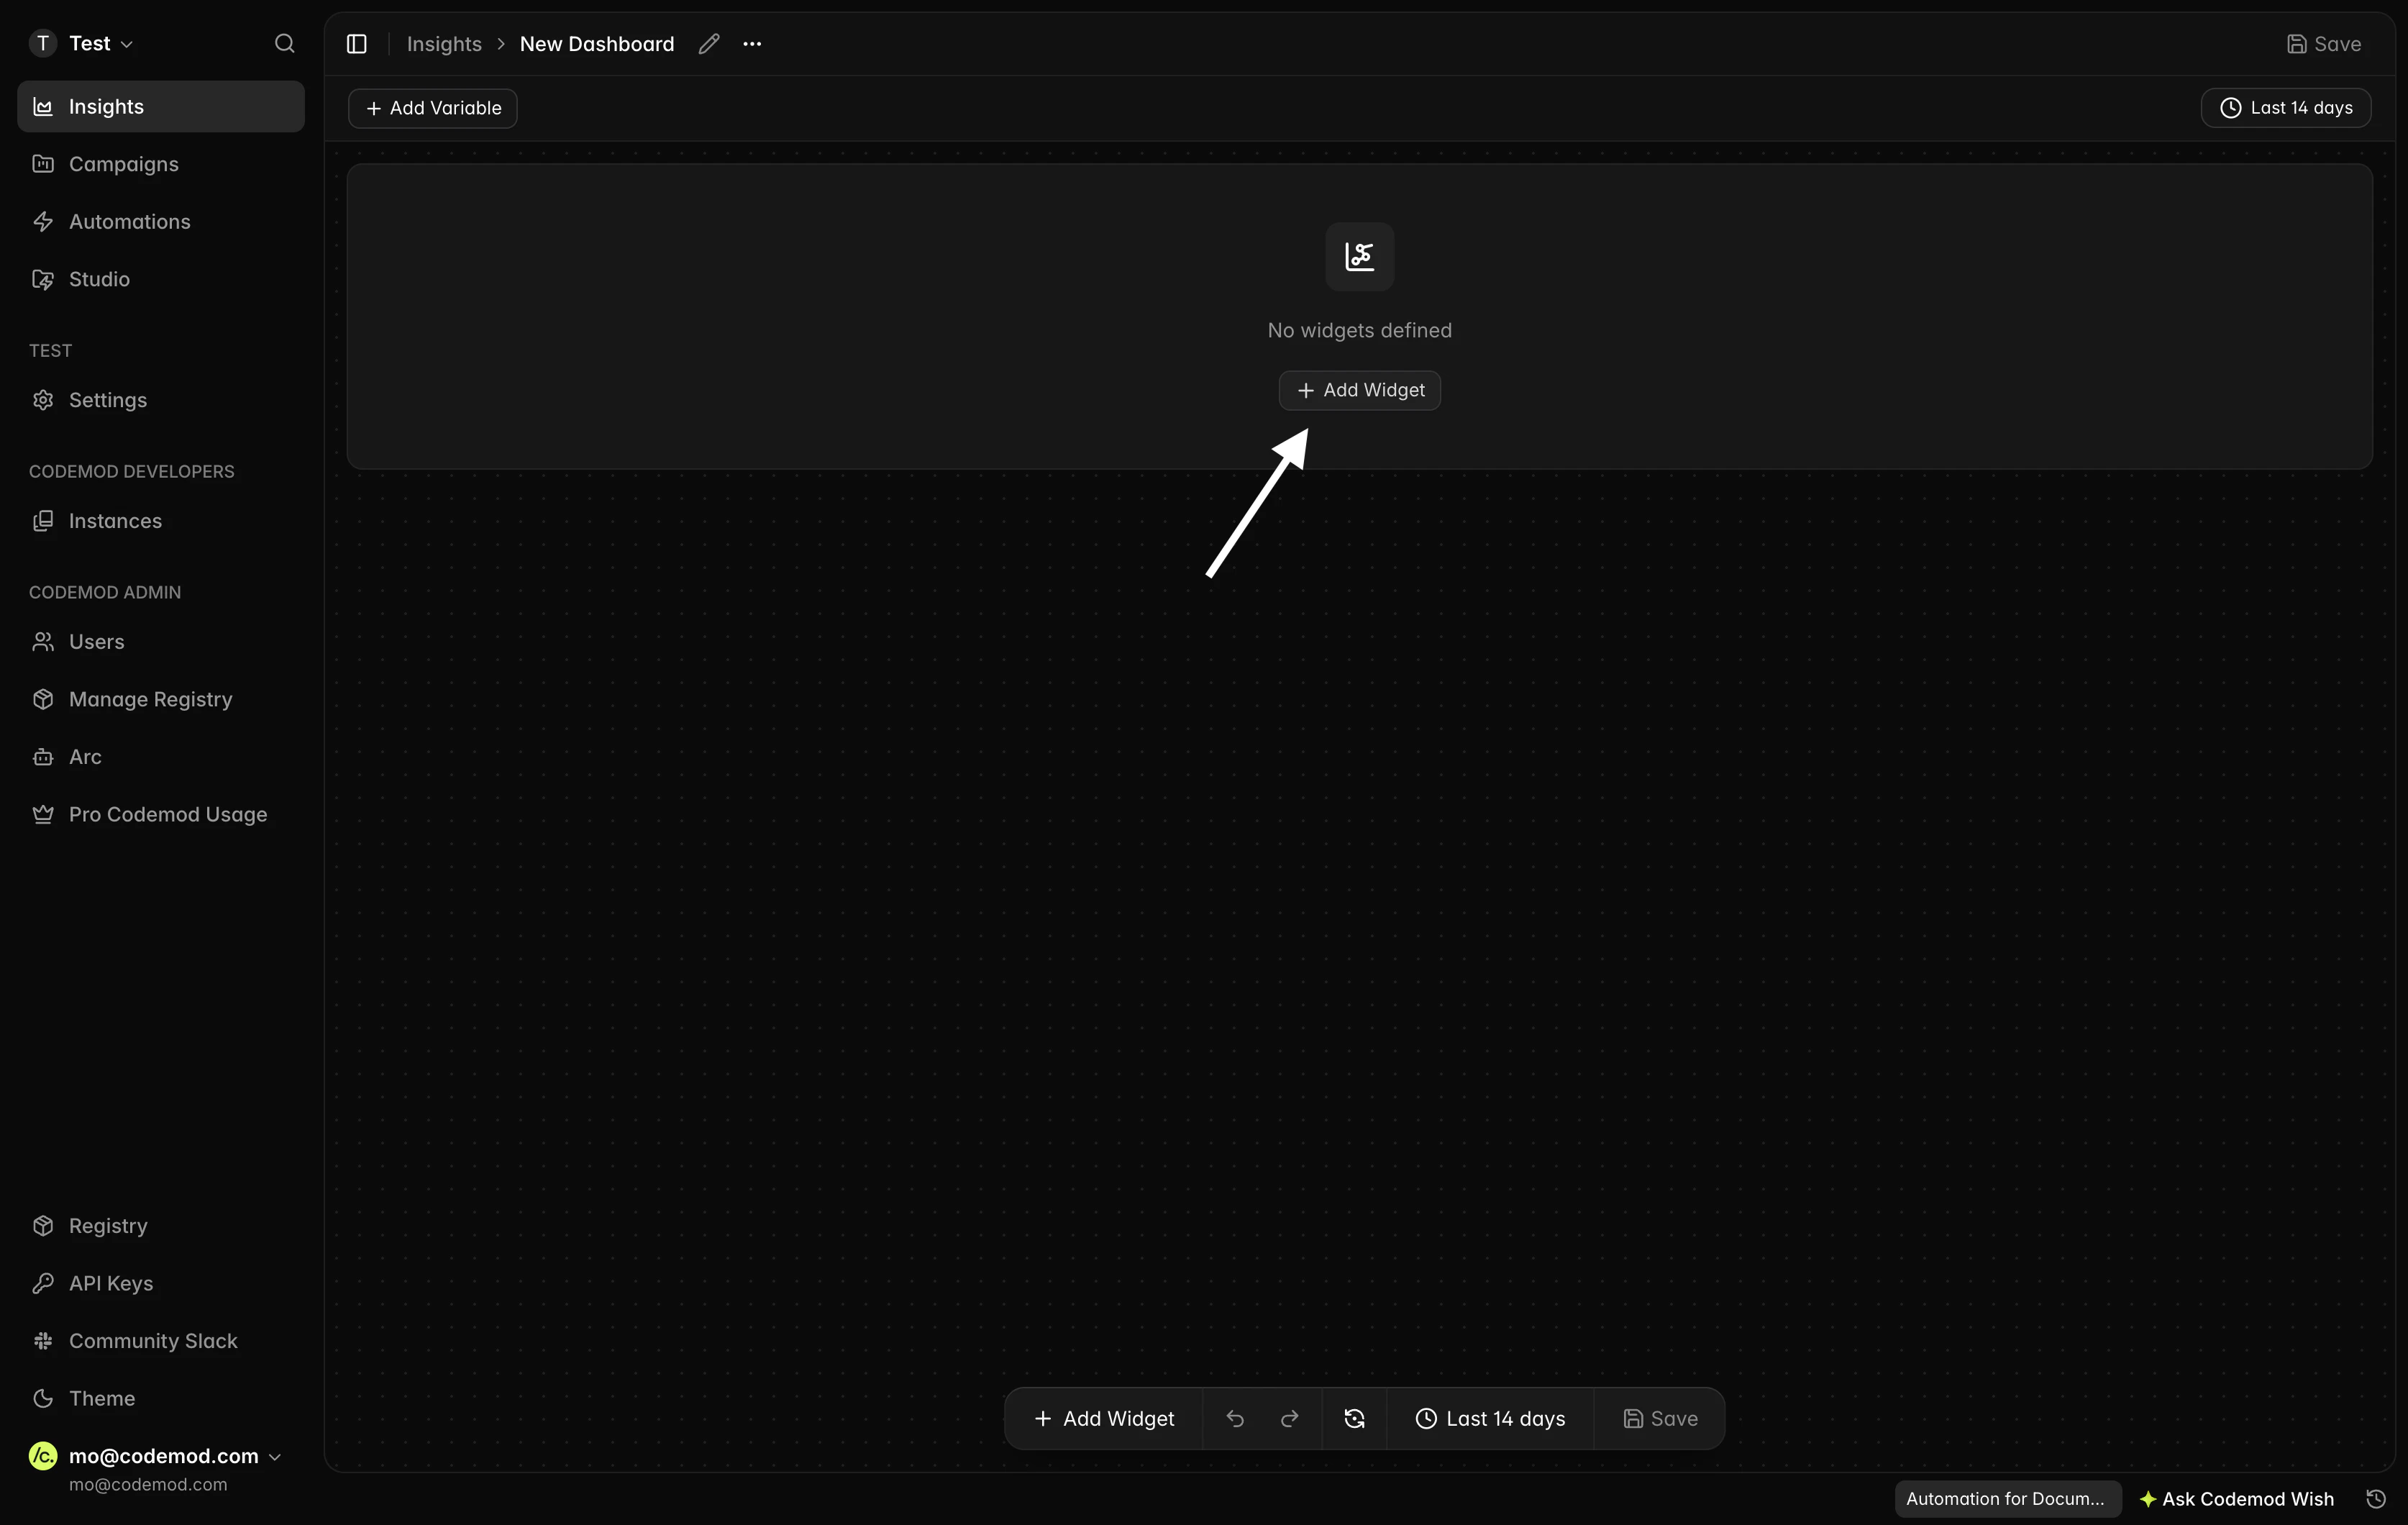
Dashboards are the top-level container for your insights. Use them to organize widgets by initiative, for example an `i18n migration` dashboard that tracks old API usage, new API adoption, and files remaining across affected repositories.
To create a new dashboard, go to `Insights → Create Dashboard`.
 After a completed [Grep](/enterprise/grep) search, you can create an Insights dashboard from the same query and repository selection. For an AI-native experience while viewing a dashboard, try [Codemod Wish](/enterprise/codemod-wish).
## Widgets
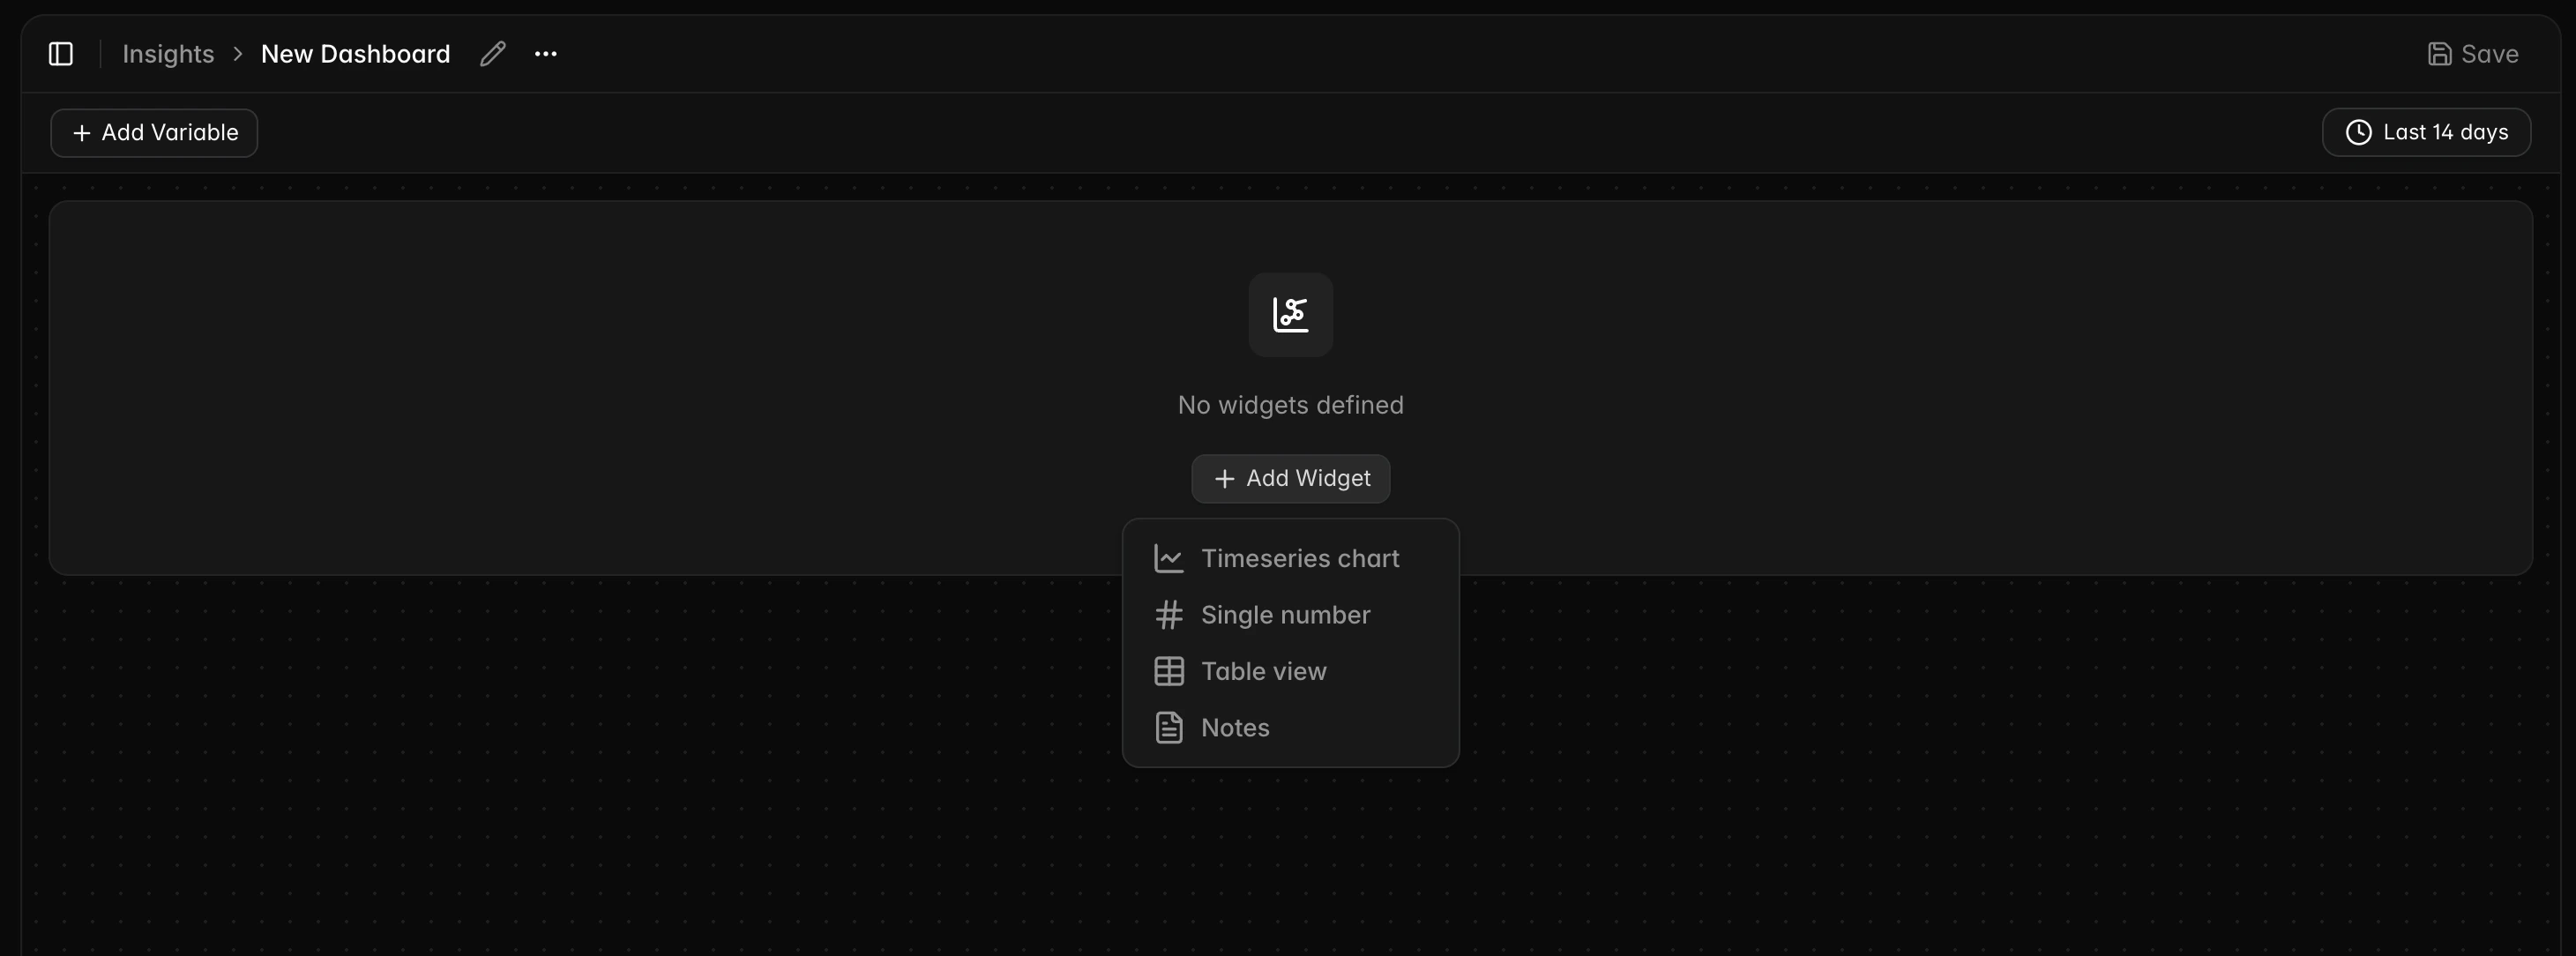
Widgets are the building blocks of a dashboard. Insights supports four widget types:
* **Timeseries chart** - track how a metric changes over time, such as deprecated API calls trending down week over week.
* **Single number** - show a point-in-time value, such as total files still using an old pattern.
* **Table view** - show breakdowns with sorting and row limits, such as remaining work by repository or codeowner.
* **Notes** - add Markdown context, caveats, interpretation, or next actions.
Timeseries chart, single number, and table view widgets are query-backed. They run one or more queries against your repositories and render the results in the selected format. Notes widgets do not run queries.
After a completed [Grep](/enterprise/grep) search, you can create an Insights dashboard from the same query and repository selection. For an AI-native experience while viewing a dashboard, try [Codemod Wish](/enterprise/codemod-wish).
## Widgets
Widgets are the building blocks of a dashboard. Insights supports four widget types:
* **Timeseries chart** - track how a metric changes over time, such as deprecated API calls trending down week over week.
* **Single number** - show a point-in-time value, such as total files still using an old pattern.
* **Table view** - show breakdowns with sorting and row limits, such as remaining work by repository or codeowner.
* **Notes** - add Markdown context, caveats, interpretation, or next actions.
Timeseries chart, single number, and table view widgets are query-backed. They run one or more queries against your repositories and render the results in the selected format. Notes widgets do not run queries.
 Each query-backed widget can contain up to 10 queries. Use the query source selector to choose the data source for each query:
* **[JSSG Codemod](/enterprise/insights/jssg-queries)** - runs inline JSSG source, a JSSG codemod package, or a JSSG source template variable.
* **[ast-grep (YAML)](/enterprise/insights/ast-grep-queries)** - runs an ast-grep YAML rule against selected repositories.
* **[Smart](/enterprise/insights/smart-queries)** - describes a file characteristic in natural language and returns a file count.
* **[Dependencies](/enterprise/insights/dependency-queries)** - queries indexed dependency data from selected repositories.
You can select the query source from the dropdown at the start of each query.
Each query-backed widget can contain up to 10 queries. Use the query source selector to choose the data source for each query:
* **[JSSG Codemod](/enterprise/insights/jssg-queries)** - runs inline JSSG source, a JSSG codemod package, or a JSSG source template variable.
* **[ast-grep (YAML)](/enterprise/insights/ast-grep-queries)** - runs an ast-grep YAML rule against selected repositories.
* **[Smart](/enterprise/insights/smart-queries)** - describes a file characteristic in natural language and returns a file count.
* **[Dependencies](/enterprise/insights/dependency-queries)** - queries indexed dependency data from selected repositories.
You can select the query source from the dropdown at the start of each query.
 ### Formulas
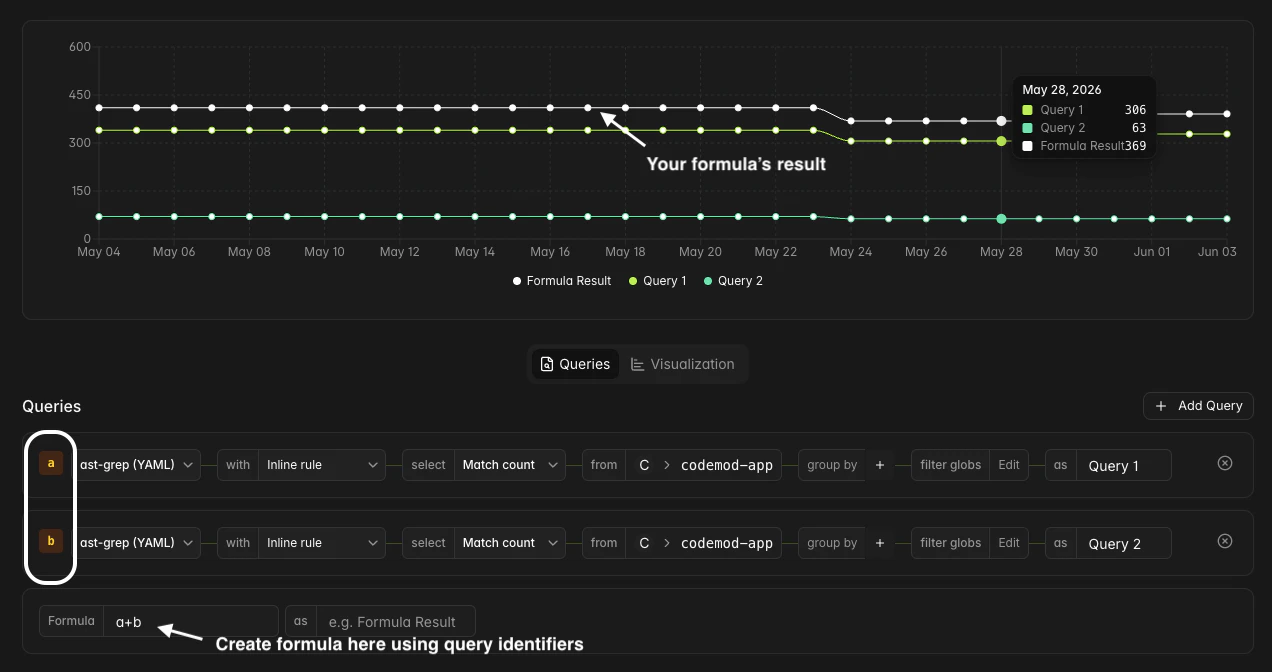
You can combine multiple query results with a formula. Queries are assigned alphabetical variable names (`a`, `b`, `c`, ...) that you can reference in the formula expression.
You can also give the formula result a name using the formula alias field (e.g. `Formula Result`).
### Formulas
You can combine multiple query results with a formula. Queries are assigned alphabetical variable names (`a`, `b`, `c`, ...) that you can reference in the formula expression.
You can also give the formula result a name using the formula alias field (e.g. `Formula Result`).
 ### Visualization settings
Each query-backed widget has visualization options in the **Visualization** tab:
* **Timeseries chart** - choose `Line`, `Bar`, or `Area`, set a Y-axis label, and choose whether to stack series or show dots.
* **Single number** - set a prefix, suffix, and number format.
* **Table view** - configure sorting, row limits, and number formatting.
### Time range
Timeseries widgets include a time range selector that controls the analysis window. You can inherit the dashboard default or set a widget-specific range.
The time range picker supports:
* **Quick ranges** - last 7, 14, 30, 60, or 90 days, and last 4, 8, or 12 weeks.
* **Absolute ranges** - a start and end date, entered manually or selected from the calendar.
* **Now expressions** - values such as `now-30d`, `now-4w`, and `now`.
## Queries
Insights supports four query sources. Each source has its own configuration options and best-fit use cases:
Programmatic analysis, package-backed metrics, and semantic dimensions.
Syntax-level pattern counts with ast-grep YAML rules.
Track package adoption, exposure, and dependency drift.
Natural-language file-count signals before you have an exact rule.
## Template variables
Template variables let you parameterize a dashboard so the same widgets can be reused with different inputs. For example, you can define a repository variable and use it across all widgets, then switch the selected repositories from one place.
To add a template variable, click **Add variable** at the top of your dashboard.
### Visualization settings
Each query-backed widget has visualization options in the **Visualization** tab:
* **Timeseries chart** - choose `Line`, `Bar`, or `Area`, set a Y-axis label, and choose whether to stack series or show dots.
* **Single number** - set a prefix, suffix, and number format.
* **Table view** - configure sorting, row limits, and number formatting.
### Time range
Timeseries widgets include a time range selector that controls the analysis window. You can inherit the dashboard default or set a widget-specific range.
The time range picker supports:
* **Quick ranges** - last 7, 14, 30, 60, or 90 days, and last 4, 8, or 12 weeks.
* **Absolute ranges** - a start and end date, entered manually or selected from the calendar.
* **Now expressions** - values such as `now-30d`, `now-4w`, and `now`.
## Queries
Insights supports four query sources. Each source has its own configuration options and best-fit use cases:
Programmatic analysis, package-backed metrics, and semantic dimensions.
Syntax-level pattern counts with ast-grep YAML rules.
Track package adoption, exposure, and dependency drift.
Natural-language file-count signals before you have an exact rule.
## Template variables
Template variables let you parameterize a dashboard so the same widgets can be reused with different inputs. For example, you can define a repository variable and use it across all widgets, then switch the selected repositories from one place.
To add a template variable, click **Add variable** at the top of your dashboard.
 ### Variable types
| Type | Description |
| --------------- | -------------------------------------------------------------------------------------------------------------------------------------------------- |
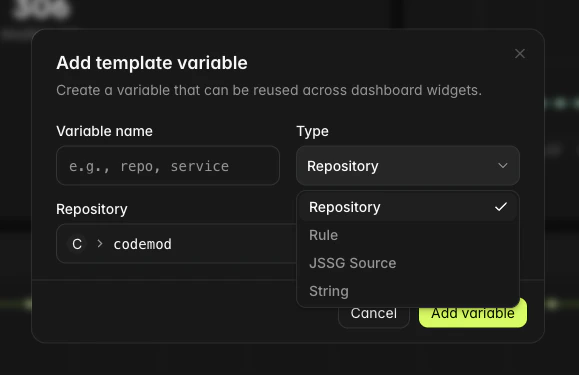
| **Repository** | Select one or more repositories. Repository selectors support up to 10 repositories by default. |
| **Rule** | Define an ast-grep YAML rule that can be reused across multiple widgets. |
| **JSSG Source** | Define JSSG source that can be reused across multiple widgets. |
| **String** | Define a text value, optionally with a fixed set of dropdown options. Use string variables for dimension filters, group-by keys, or Smart prompts. |
### Use template variables
Once created, template variables appear as selectable options in query configuration fields. When configuring a query's repository, rule, or JSSG source, you can choose between specifying a value directly or referencing a template variable.
### Variable types
| Type | Description |
| --------------- | -------------------------------------------------------------------------------------------------------------------------------------------------- |
| **Repository** | Select one or more repositories. Repository selectors support up to 10 repositories by default. |
| **Rule** | Define an ast-grep YAML rule that can be reused across multiple widgets. |
| **JSSG Source** | Define JSSG source that can be reused across multiple widgets. |
| **String** | Define a text value, optionally with a fixed set of dropdown options. Use string variables for dimension filters, group-by keys, or Smart prompts. |
### Use template variables
Once created, template variables appear as selectable options in query configuration fields. When configuring a query's repository, rule, or JSSG source, you can choose between specifying a value directly or referencing a template variable.
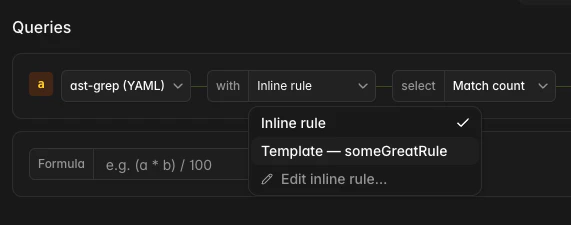 String variables can be referenced in group-by and dimension filter fields with the `$variableName` syntax. For Smart queries, bind a string variable as the prompt in the editor, or set the prompt to `$variableName` so the same dashboard can switch characteristics without editing every widget.
Variables can be edited from the dashboard view. Widgets that reference a variable refresh with the updated value.
Template variables are especially useful for dashboards you reuse across repositories, teams, or migration phases.
## Dashboard templates
When you publish a package with JSSG steps to the [Codemod Registry](/enterprise/registry), Codemod attaches a default Insights dashboard template. People who start an Insights dashboard from your package get that template.
You can replace the default with a dashboard you built. If the package is published by an organization, any organization member with developer or admin privileges can update the template.
### Update a package template
Create or open an Insights dashboard. Add query-backed widgets that use only your published package. For a bundle, widgets can also be powered by the bundle's child packages. You can optionally include Notes widgets.
When the dashboard looks right, click the three-dot menu next to the dashboard name and select **Update package template**.
String variables can be referenced in group-by and dimension filter fields with the `$variableName` syntax. For Smart queries, bind a string variable as the prompt in the editor, or set the prompt to `$variableName` so the same dashboard can switch characteristics without editing every widget.
Variables can be edited from the dashboard view. Widgets that reference a variable refresh with the updated value.
Template variables are especially useful for dashboards you reuse across repositories, teams, or migration phases.
## Dashboard templates
When you publish a package with JSSG steps to the [Codemod Registry](/enterprise/registry), Codemod attaches a default Insights dashboard template. People who start an Insights dashboard from your package get that template.
You can replace the default with a dashboard you built. If the package is published by an organization, any organization member with developer or admin privileges can update the template.
### Update a package template
Create or open an Insights dashboard. Add query-backed widgets that use only your published package. For a bundle, widgets can also be powered by the bundle's child packages. You can optionally include Notes widgets.
When the dashboard looks right, click the three-dot menu next to the dashboard name and select **Update package template**.